Creator: Tamás Varga
Insights
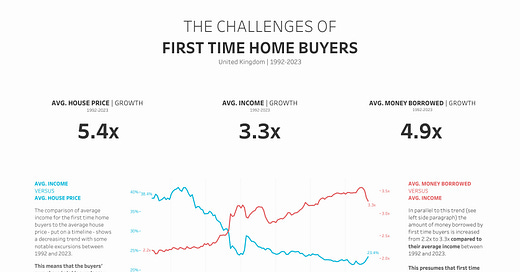
The chart compares the average income of first time home buyers to the average house price - for example, in 1992, the average income was 38.4% of the house price.
Additionally, it also showcases the average money borrowed as a multiple of average income - for example, in 2023, a first time home buyer in the UK borrowed 3.3x their annual income.
The overlapped line chart indicates that in 2023, the average home buyer is borrowing 50% more than they would have in 1992. Also, with their own income they are able to get a lesser share of the house (down by ~40% of 1992 share value of 38.4%)


